lunedì 21 febbraio 2011

Il corso di laurea in Fisica dell'Atmosfera e Meteorologia organizza l'attività di orientamento:
"Come osservare l’Atmosfera: metodi, strumenti, misure"
Quinto Congresso Scientifico di Orientamento alla Fisica dell’Atmosfera, Meteorologia e Climatologia nei locali del dipartimento di Fisica (V.le Berti Pichat 6/2, piano -1) a Bologna il giorno 2 marzo 2011.
Maggiori dettagli e la locandina del congresso sono consultabili sul sito di facoltà
http://corsi.unibo.it/Laurea/FisicaAtmosferaMeteorologia/Eventi/2011/02/quinto-congresso-fam.aspx

mercoledì 16 febbraio 2011

Winter Cloud Streets, North Atlantic


What do you get when you mix below-freezing air temperatures, frigid northwest winds from Canada, and ocean temperatures hovering around 39 to 40 degrees Fahrenheit (4 to 5 degrees Celsius)? Paved highways of clouds across the skies of the North Atlantic.

The Moderate Resolution Imaging Spectroradiometer (MODIS) on NASA’s Terra satellite collected this natural-color view of New England, the Canadian Maritimes, and coastal waters at 10:25 a.m. U.S. Eastern Standard Time on January 24, 2011. Lines of clouds stretch from northwest to southeast over the North Atlantic, while the relatively cloudless skies over land afford a peek at the snow that blanketed the Northeast just a few days earlier.

Cloud streets form when cold air blows over warmer waters, while a warmer air layer—or temperature inversion—rests over top of both. The comparatively warm water of the ocean gives up heat and moisture to the cold air mass above, and columns of heated air—thermals—naturally rise through the atmosphere. As they hit the temperature inversion like a lid, the air rolls over like the circulation in a pot of boiling water. The water in the warm air cools and condenses into flat-bottomed, fluffy-topped cumulus clouds that line up parallel to the wind.

Though they are easy to explain in a broad sense, cloud streets have a lot of mysteries on the micro scale. A NASA-funded researcher from the University of Wisconsin recently observed an unusual pattern in cloud streets over the Great Lakes. Cloud droplets that should have picked up moisture from the atmosphere and grown in size were instead shrinking as they moved over Lake Superior. Read more in an interview at What on Earth?

1.
References
2. NASA Earth Observatory (2006, January 31). Cloud Streets in the Bering Sea. Accessed February 14, 2011.
3. NASA Earth Observatory (2005, November 29). Cloud Streets Pave Hudson Bay. Accessed February 14, 2011.
4. Weather Online (n.d.). Cloud streets. Accessed February 14, 2011.

NASA image by Jeff Schmaltz, MODIS Rapid Response Team, Goddard Space Flight Center. Caption by Michael Carlowicz.

Instrument:
Terra - MODIS

Nasa Earth Observatory del 15 febbraio 2011

mercoledì 9 febbraio 2011

CALIPSO Spies Polar Stratospheric Clouds


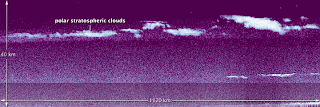
NASA’s Cloud-Aerosol Lidar and Infrared Pathfinder Satellite Observation (CALIPSO) satellite was in the right place at the right time earlier this month. On January 4, 2011, while flying over the east coast of Greenland, CALIPSO caught a top-down glimpse of an unusual atmospheric phenomenon—polar stratospheric clouds (PSCs), also known as nacreous clouds.

Clouds do not usually form in the stratosphere because of the dry conditions. But in the polar regions, often near mountain ranges, atmospheric gravity waves in the lower atmosphere (troposphere) can push just enough moisture into the high altitudes. The extremely low temperatures of the stratosphere condense ice and nitric acid into clouds that play an important role in depletion of stratospheric ozone.

The top image was assembled from data from CALIPSO’s Light Detection and Ranging instrument, or lidar, which sends pulses of laser light into Earth's atmosphere. The light bounces off particles in the air and reflects back to a receiver that can measure the distance to and thickness of the particle- and air masses below. The data was acquired between 4:30 and 4:44 Universal Time on January 4, 2011, as the satellite flew 1120 kilometers (695 miles) from north to south over the Greenland Sea and Denmark Strait, as depicted in the map above.

CALIPSO has observed stratospheric clouds before, but never one this high, says Mike Pitts, an atmospheric scientist at NASA's Langley Research Center. This cloud reached an altitude of more than 30 kilometers (19 miles).

The cloud was the result of mountain waves in the atmosphere, which form when stable air masses pass over mountains or high ice sheets, providing vertical lift. Pitts said such stratospheric ice clouds are rare because they only form when the jet stream in the Arctic is properly aligned with the edge of the polar vortex, a large air pressure system over the poles. The circulating air in the vortex needs to align with the jet stream to create enough vertical motion and propagate the waves to the upper atmosphere. The January 4 cloud was formed when those winds aligned and sent an air mass up over the high ice sheet and mountains of Greenland.

NASA Earth Observatory image by Jesse Allen, using CALIPSO data provided by the Langley Atmospheric Science Data Center, with meteorological analyses by Andreas Dörnbrack, Institute of Atmospheric Physics, DLR Oberpfaffenhofen, Germany. Caption by Kristyn Ecochard and Michael Carlowicz.

Instrument:
CALIPSO - CALIOP

Nasa Earth Observatory del 9 febbraio 2011

mercoledì 26 gennaio 2011

Eruption of Stromboli Volcano, Italy


The mild eruptions of Italy’s Stromboli Volcano are so frequent and numerous that an entire style of volcanism—strombolian—is named after the volcano. Strombolian eruptions are characterized by nearly continuous lava fountaining, accompanied by emissions of gas, ash, and volcanic bombs. The sight of that lava spraying into the sky at night has led people to nickname Stromboli the “Lighthouse of the Mediterranean.”
This natural-color satellite image shows the island of Stromboli, the volcano’s cloud-covered summit, and a thin volcanic plume on January 13, 2011. The image was acquired by the Advanced Land Imager aboard Earth Observing-1 (EO-1).
The volcanic island has been building, according to geologists, for nearly 200,000 years. Historical records of eruptions at Stromboli date back 2,400 years, and carbon dating suggests that the volcano has been almost continuously active for at least 1,400. The current eruption has been going on uninterrupted since 1932. For most of the past 5,000 years, eruptions and venting have sprung from the Sciara del Fuoco (Stream of Fire), a large collapse scar on the northwest side of the island.
The peak of the island volcano stands 924 meters (3,030 feet) above sea level, but in fact the entire structure rises more than 2,000 meters (6,500 feet) from the sea floor. The volcano is a result of the subduction of the African tectonic plate as it collides with and slides under the Eurasian plate.
Today, a few hundred people call the island home, though past populations counted in the thousands. In Jules Verne's novel Journey to the Center of the Earth (Voyage au Centre de la Terre), Axel and Otto Lidenbrock finish their journey by climbing out through Stromboli.
References
Geology.com (n.d) Stromboli, Italy. Accessed January 18, 2011.
Global Volcanism Program. (2010). Stromboli. Accessed January 18, 2011.
Rosi, M., Bertagnini, A., Landi, P. (2000). Onset of the persistent activity at Stromboli Volcano (Italy). Bulletin of Volcanology, 62 (4), 294–300.
Stromboli online. (2010). Stromboli - the volcano. Accessed January 18, 2011.
Nasa Earth Observatory del 22 gennaio 2011

A Clear View of the Alps


The Alps form a crescent stretching from the Mediterranean coasts of Italy and France to Vienna, Austria. On January 17, 2011, clear skies afforded the Moderate Resolution Imaging Spectroradiometer (MODIS) on NASA’s Terra satellite an uninterrupted view of the mountain range. This natural-color image shows snow-capped mountains interspersed with vegetated valleys. Clouds snake through valleys in the north and west, and a nearly continuous cloud bank fills the Po Valley in the south, but skies over the mountains are clear.
The Alps’s began forming tens of millions of years ago, when the African tectonic plate slowly collided with the European plate. The plate collision helped close the western part of the ancient Tethys Sea and lifted up the massive European mountain chain that persists today.
Across the Earth, some mountain ranges are gaining elevation through tectonic uplift, while others are losing elevation through erosion. A study published in Tectonophysics in 2009 found that the Alps are doing both. The actions of glaciers and rivers scrape away fine sediment, which is carried away by water and wind. As this happens, the mountain range loses weight, lightening the load for the Earth’s crust. So just as ice and water scrape off the top, deeper rock layers push up from below. In the Alps, these processes appear to be in equilibrium, keeping the mountain range at a near-constant elevation.
In the Alps region, the valleys have attracted as much scientific attention as the peaks. Over hundreds of thousands of years, advancing Pleistocene glaciers ground away massive quantities of rock, leaving broad, U-shaped valleys. In between glacial advances, rivers carved deep, V-shaped gorges in many valley floors. Geologists long differed about how the steep, river-carved gorges could persist once the glaciers re-advanced. Many thought each new advance would wipe out the underlying gorge, and that the gorges seen today must have been carved since the last glacial episode ended.
But a study published in Nature Geoscience in 2011 argued that many of the steep gorges at the bottoms of the Alps probably persisted through multiple glacial episodes. After mapping more than 1,000 gorges, and calculating the rate at which rivers could have eroded bedrock since the last glacial episode, the researchers concluded that rivers could not work fast enough to carve such deep gorges. The depths of the gorges indicate much older formations. As glaciers re-advanced, the researchers concluded, sediment filled the deep gorges and preserved them below glacial ice. After the glaciers retreated again, fresh rivers cleaned out the sediments and continued carving away at the bedrock.
References
Champagnac, J.-D., Schlunegger, F., Norton, K., von Blanckenburg, F., Abbühl, L.M., Schwab, M. (2009). Erosion-driven uplift of the modern Central Alps. Tectonophysics,474, 236–249.
Dixon, J.L. (2011). Deceptively old Alpine gorges. Nature Geoscience, 4, 8–9.
Encyclopedia Britannica. (2011). Alps. Accessed January 19, 2011.
Lamb, M.P., Fonstad, M.A. (2010). Rapid formation of a modern bedrock canyon by a single flood event. Nature Geoscience, 3, 477–481.
Montgomery, D.R., Korup, O. (2011). Preservation of inner gorges through repeated Alpine glaciations. Nature Geoscience, 4, 62–67.
Romans, B. (2011, January 8). Rapid canyon formation and uniformitarianism. Clastic Detritus. Accessed January 21, 2011.
Science Daily. Science Reference: Geology of the Alps. Accessed January 19, 2011.
Science Daily. (2009, November 6). Are the Alps Growing or Shrinking? Accessed January 19, 2011.
Stricherz, V. (2010, December 5). New research shows rivers cut deep notches n theAlps’ broad glacial valleys. EurekAlert. Accessed January 21, 2011.
Wikipedia. (2011, January 16). Alps. Accessed January 19, 2011.
NASA image courtesy Jeff Schmaltz, MODIS Rapid Response Team at NASA GSFC. Caption by Michon Scott.
Instrument: Terra - MODIS
Nasa Earth Observatory del 21 gennaio 2011

Arctic Oscillation Chills North America, Warms Arctic


Snow fell in the U.S. Deep South, severe storms battered the East Coast, and International Falls, Minnesota, set a new temperature record: -46 degrees Fahrenheit (-43 degrees Celsius) on January 21. But in areas north of the United States and southern Canada, temperatures were above normal. In fact, unusual warmth forced residents of Iqaluit, capital of the Canadian territory of Nunavut, to cancel their New Year’s snowmobile parade.
This map of the United States, Canada, eastern Siberia, and Greenland shows temperature anomalies for January 9 to 16, 2011, compared to the same dates from 2003 through 2010. The anomalies are based on land surface temperatures observed by the Moderate Resolution Imaging Spectroradiometer (MODIS) on NASA’s Aqua satellite. Areas with above-average temperatures appear in red and orange, and areas with below-average temperatures appear in shades of blue. Oceans, lakes, and areas with insufficient data (usually because of persistent clouds) appear in gray.
Because this image shows temperature anomalies rather than absolute temperatures, red or orange areas are not necessarily warmer than blue areas. The reds and blues indicate local temperatures that are warmer or colder than the norm for that particular area. The overall configuration of warmer-than-normal temperatures in the north and cooler-than-normal temperatures in the south probably results from a climate pattern known as the Arctic Oscillation (AO).
The AO is a pattern of differences in air pressure between the Arctic and mid-latitudes. When the AO is in “positive” phase, air pressure over the Arctic is low, pressure over the mid-latitudes is high, and prevailing winds confine extremely cold air to the Arctic. But when the AO is in “negative” phase, the pressure gradient weakens. The air pressure over the Arctic is not quite so low, and air pressure at mid-latitudes is not as high. In this negative phase, the AO enables Arctic air to slide south and warm air to slip north.
The AO went into negative phase in the Northern Hemisphere winter of 2009–2010. The AO was in negative mode again in the winter of 2010–2011, affecting temperatures across the Northern Hemisphere as early as December 2010.
The AO can change from positive to negative mode, and vice versa, sometimes in a matter of weeks. Forecasts from the U.S. National Oceanic and Atmospheric Administration (NOAA) indicated that the AO might return to positive mode in February 2011, although the possibility of a lingering negative mode remained.
References
Gariss, E.B. (2011, January). Blame the Arctic Oscillation! The Old Farmer's Almanac. Accessed January 25, 2011.
Gillis, J. (2011, January 24). Cold Jumps Arctic “Fence,” Stoking Winter’s Fury. The New York Times. Accessed January 25, 2011.
NOAA Climate Prediction Center. (2011, January). Monitoring Weather and Climate. Accessed January 25, 2011.
O’Carroll, Staff. (2011, January). The Five Coldest Places on Earth. Christian Science Monitor. Accessed January 25, 2011.
NASA Earth Observatory image created by Jesse Allen, using data provided by the Land Processes Distributed Active Archive Center (LPDAAC). Caption by Michon Scott.
Instrument: Aqua - MODIS
Nasa Earth Observatory del 26 gennaio 2011

mercoledì 19 gennaio 2011

Different Records, Same Warming Trend


Each year, scientists from several major institutions—NASA’s Goddard Institute for Space Studies (GISS), NOAA’s National Climatic Data Center (NCDC), the Japanese Meteorological Agency, and the Met Office Hadley Centre in the United Kingdom—tally the temperature data collected at stations around the world and make independent judgments about whether the year was warm or cool compared to previous years.

On January 12, 2011, the NASA group announced that 2010 had tied 2005 as the warmest year in their 131-year instrumental record. NOAA also declared 2010 to be tied with 2005. The Japanese Meteorological Agency noted in a preliminary analysis that 2010 was the second warmest. The Met Office Hadley Centre has yet to make its announcement.

But how much does the ranking of a single year matter? Not all that much, said James Hansen, the director of NASA GISS. In his group’s analysis, 2010 differed from 2005 by less than 0.01°C (0.018 °F), a difference so small that the temperatures of the two years are almost indistinguishable, given the uncertainty of the calculation. Meanwhile, the third warmest year, 2009, is so close to 1998, 2002, 2003, 2006, and 2007 (the maximum difference between years is 0.03°C), that all six years are virtually tied.

What matters more than a yearly record from a single group is the longer trend, as shown in the plot at the top of this page. The four records are unequivocal: the world has warmed since 1880, and the last decade has been the warmest on record.

When we focus on the annual rankings, the differences between the temperature analyses can be confusing. For example, GISS previously ranked 2005 as the warmest, while the Met Office listed 1998. The discrepancy helped fuel a misconception that findings from the research groups varied sharply or contained large degrees of uncertainty. It also fueled a misconception that global warming had stopped in 1998.

“The official records vary slightly because of subtle differences in the way we analyze the data,” said Reto Ruedy, one of Hansen’s colleagues at GISS. “But they also agree extraordinarily well.”

All four records above show peaks and valleys in sync with each other. All show particularly rapid warming in the past few decades. And all show the last decade as the warmest.

The small discrepancies between the records are mostly due to the way scientists from each institution handle regions of the world where temperature-monitoring stations are scarce—parts of Africa, Antarctica, the Arctic, and the Amazon. For instance, GISS fills in the gaps (see the first global map above) with data from the nearest land stations. The Met Office analysis (second of the two global maps above) leaves areas of the Arctic Ocean out.

Both approaches pose problems. By not inferring data, the Met Office assumes that the areas without stations have a warming equal to that of the entire Northern Hemisphere—a value that satellite and field measurements suggest is too low, given the observed rate of Arctic sea ice loss. On the other hand, GISS’s approach may either overestimate or underestimate Arctic warming.

“There’s no doubt that estimates of Arctic warming are uncertain, and should be regarded with caution,” Hansen said. “Still, the rapid pace of Arctic ice retreat leaves little question that temperatures in the region are rising fast, perhaps faster than we assume in our analysis.”

The temperature records also differ slightly because the point of reference that each group uses to calculate global temperature is different. It is not possible to reliably calculate absolute global average surface temperatures, so scientists instead calculate a relative measure called a “temperature anomaly.” They compare average temperatures at any given time and place to a long-term average, or base period, for each area. GISS uses a base period of 1951 to 1980; the Met Office uses 1961 to 1990; the Japanese Meteorological Agency uses 1971 to 2000; and NCDC uses the entire 20th century.

This means that numerical values of the temperature anomalies differ. But it does not change the magnitude of temperature changes over the past century.

NASA images by Robert Simmon, based on data from the NASA Goddard Institute for Space Studies, NOAA National Climatic Data Center, Met Office Hadley Centre/Climatic Research Unit, and the Japanese Meteorological Agency. Caption by Adam Voiland and Mike Carlowicz.

Instrument:
In situ Measurement
Nasa Earth Observatory del 14 gennnaio 2011

Activity at Mt. Etna


In mid-January 2011, Europe’s largest and most active volcano rumbled with new energy and lit up the Sicilian night with a fountain of lava. The Moderate Resolution Imaging Spectroradiometer (MODIS) on NASA’s Terra satellite captured this image of the east coast of Sicily and of Mount Etna as it was spewing ash or steam on January 11, before the lava eruption.

According to news reports from Italy, tremors were detected around Mount Etna on the evening of January 11; by the next evening, lava was shooting hundreds of feet into the air and flowing toward the western wall of the Valle del Bove. An ash plume from the eruption shuttered Fontanarossa Airport in nearby Catania (Sicily’s second-largest city) for much of January 12, with flights diverted or canceled. To date, there have been no reports of injuries.

The massive 3,350-meter-high volcano is one of the most consistently active volcanoes in the world, and accounts of its rumblings go back to 1500 B.C. Since at least October 2010, the volcano was showing signs of unrest that slowly built to the January 12 eruption.

An ongoing collection of ground-based photos and webcams of the eruption can be viewed online.

1.
References
2. Global Volcanism Program (n.d.) Etna. Accessed January 14, 2011.
3. Global Volcanism Program (2011, January 12) Weekly Volcanic Activity Report. Accessed January 14, 2011.
4. MSNBC/Our Amazing Planet (2011, January 13) Mount Etna blasts lava, ash into the sky. Accessed January 14, 2011.
5. Volcano Live (n.d.) Mount Etna Volcano. Accessed January 14, 2011.

NASA image courtesy of the MODIS Rapid Response Team, Goddard Space Flight Center. Caption by Michael Carlowicz.

Instrument:
Terra - MODIS

Nasa Earth Observatory del 15 gennaio 2011

giovedì 13 gennaio 2011

NASA Research Finds 2010 Tied for Warmest Year on Record

La Nina Strong che ha iniziato a manifestarsi intensamente nella seconda parte dell'anno non è bastata a salvare il 2010 dall'aggiudicarsi il posto di anno globalmente più caldo dal 1880, quando hanno iniziato a rendersi disponibili le misure della NASA.

mercoledì 5 gennaio 2011

Auroral Rocket in Norway


The aurora borealis and aurora australis—the northern and southern lights—are visible manifestations of a connection between the Sun and Earth. Blasts of energy and magnetically charged particles from the Sun are constantly flowing out into space and crashing into the magnetic fields of Earth and other planets. At Earth, that energy stirs up the particles and energy trapped in Earth’s space, or magnetosphere, creating the auroras and disturbing the upper reaches of our atmosphere.

Photographers captured these digital photos of a four-stage Black Brant XII sounding rocket and the aurora borealis (inset) on December 12, 2010, during the NASA-funded Rocket Experiment for Neutral Upwelling (RENU). The rocket was launched from Andøya Rocket Range near Andenes, Norway, and carried instruments about 200 miles (320 kilometers) into the atmosphere to observe the aurora and the associated flow of heat, particles, and electromagnetic energy. The photograph of the aurora was taken from the Kjell Henrickson Observatory in Svalbard, which was under the apogee, or peak, of the rocket’s arc through the sky. The rocket landed in the ocean about 900 miles (1450 km) from the launch site.

The goal of RENU was to measure the flow of particles and heat both into and out of Earth’s upper atmosphere near the North Pole during an auroral event. The solar wind stirs up Earth’s magnetic field and creates electrical currents in the ionosphere. Such disturbances can also heat the atoms of the thermosphere and other atmospheric layers, expanding them and creating extra drag on satellites and spacecraft, shortening their lifespan.

Around Earth’s poles, the magnetic field stretches out from the core of the planet into space and tucks back in at the opposite pole. The place where most of those field lines bunch up poke out of the Earth usually aligns in an auroral oval, where particles and energy from space precipitate and smash into the oxygen and nitrogen in the atmosphere to make the reds, greens, and whites of auroras. The funnel-shaped area inside that auroral oval—the polar cusp—is mostly open to space. RENU launched right into that cusp region to observe the flows of particles and energy both inbound and outbound.

1.
Further Reading
2. Andoya Rocket Range (2010, December 12) Sounding Rocket Campaigns: RENU. Accessed January 3, 2011.
3. Kjell Henrickson Observatory (2010, December 12). The Waiting Game. Accessed January 3, 2011.
4. University of New Hampshire (n.d.) Magnetosphere-Ionosphere Research Lab. Accessed January 3, 2011.
5. University of New Hampshire (2010, December 13) UNH-Led Experiment Hurtled Into Aurora Above Norway By NASA Rocket. Accessed January 3, 2011.

The ground-based photograph of the rocket was taken by Kolbjørn Blix Dahle of Andøya Rocket Range. The inset photo of the aurora was taken by Fred Signeres of The Kjell Henrickson Observatory. Caption by Michael Carlowicz.

Instrument:
Photograph
Nasa Earth Observatory del 4 gennaio 2011

martedì 4 gennaio 2011

L'ombra dell'eclissi

Unico modo per godere tutti dell'eclissi di sole di stamattina sarebbe quello di poterla guardare da sopra le nubi...il canale visibile di Meteosat ci consente almeno di vedere l'ombra della Luna proiettata sulla superficie terrestre.


sabato 1 gennaio 2011

Outbreak di fine anno in Missouri

Il 2010 è terminato con un outbreak tornadico in Missouri, sugli States i contrasti tra masse d'aria possono essere incredibilmente accesi anche durante la stagione invernale!